Tabular reports
Tabular reports can be used to display your data in rows and columns forming a grid similar to a spreadsheet.
Creating a tabular report
- To create a tabular report, click the Reports button at the top right of the process page.
- Click Create New Report and then choose Tabular report.
- Provide a name for the report and click Create.

Choosing fields
To configure the report, start by choosing the fields you want to display.
There are three types of fields to choose from on the left side of the screen.
- Process fields. These are fields you created on your form and are unique only to this process.
- System fields. These are system-generated fields that are created for every process in Kissflow.
- Name - The unique Item name given to each item
- Created by - The user who created the item
- Modified by - The user who last modified the item
- Created at - The time the item was created as a draft
- Modified at - The time the form was last modified
- Flow name - The name of the flow
- Current step - The step the item is in
- Currently assigned to - The user currently assigned to the step; this field will be empty if the workflow is completed
- Status - The status of an item
- Workflow fields. These are the steps you created in your workflow. The field will display when a step was completed, who completed it, the current status, and if the deadline was crossed.
You can choose an unlimited number of fields for your report. You will see a sample set of 10 items in the report preview.

Column width, ordering
Resize the column width by placing the cursor on the edge of the column and then dragging it to the length you want. You can also drag and drop the fields to reorder them.

Filters
You can add filters based on a condition in your report. To add a filter to your report, click the Create Filter button. Choose the field that you want to based on your filter and then enter the conditions.
Click Test Filter to see how your filter would affect the sample report data.
Click +Add Condition to add more conditions to the same field. The new condition can be either AND (all conditions must be met) or OR (any one condition must be met).

Click Add Another Filter to add conditions based on another field. Report data must match all the filters you create. To remove a filter, click the Delete button (

Sorting
You can set the default sorting of your report. Choose a field, select the order as ascending or descending and then click Done.

Click Done in the lower right hand of the screen to save your configuration.
Tabular report actions
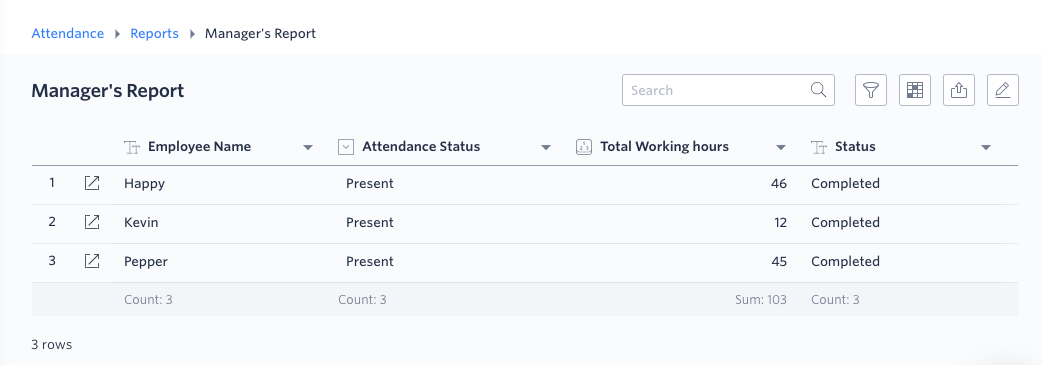
Once you have configured your report you can perform several actions to view the report.
- Search. Enter any word in the search box to find relevant items in the report.
- Filter(
) . Click the filter button to add temporary filters to highlight different items based on the parameters you choose.
- Show/hide fields (
). Click the show/hide fields button to select which fields you want to display on the current layout. You can also hide a field by clicking the Expand button (▼) beside the field name and then clicking the Hide column.
- Export (
). Click the export button to export the report as CSV, JSON or Zip file.
- Edit (
). Click the edit button to make changes to the report. Click Done to save the changes.
If you share a report with someone, they can perform all of the same actions except for editing.