Pivot tables
The pivot table can be used to quickly summarize, analyze, and compare large quantities of data. Pivot tables make it easy to convert columns into rows and rows into columns.
Creating a pivot table
- To create a pivot table, click on the Reports button at the top right of the process page.
- Click Create New Report and then choose Pivot table.
- Provide a name for the report and click Create.
Choosing fields
To configure the report, start by choosing the fields you want to display. There are two types of fields to choose from on the left side of the screen.
a) Process fields. These are fields you created on your form and are unique only to this process.
b) System fields. These are system-generated fields that are created for every process in Kissflow.
- Name - The unique Item name given to each item
- Created by - The user who created the item
- Modified by - The user who last modified the item
- Created at - The time the item was created as a draft
- Modified at - The time the form was last modified
- Flow name - The name of the flow
- Current step - The step the item is in
- Currently assigned to - The user currently assigned to the step; this field will be empty if the workflow is completed
- Status - The status of an item
You can choose an unlimited number of fields for your report. You will see a sample set of 10 items in the report preview.
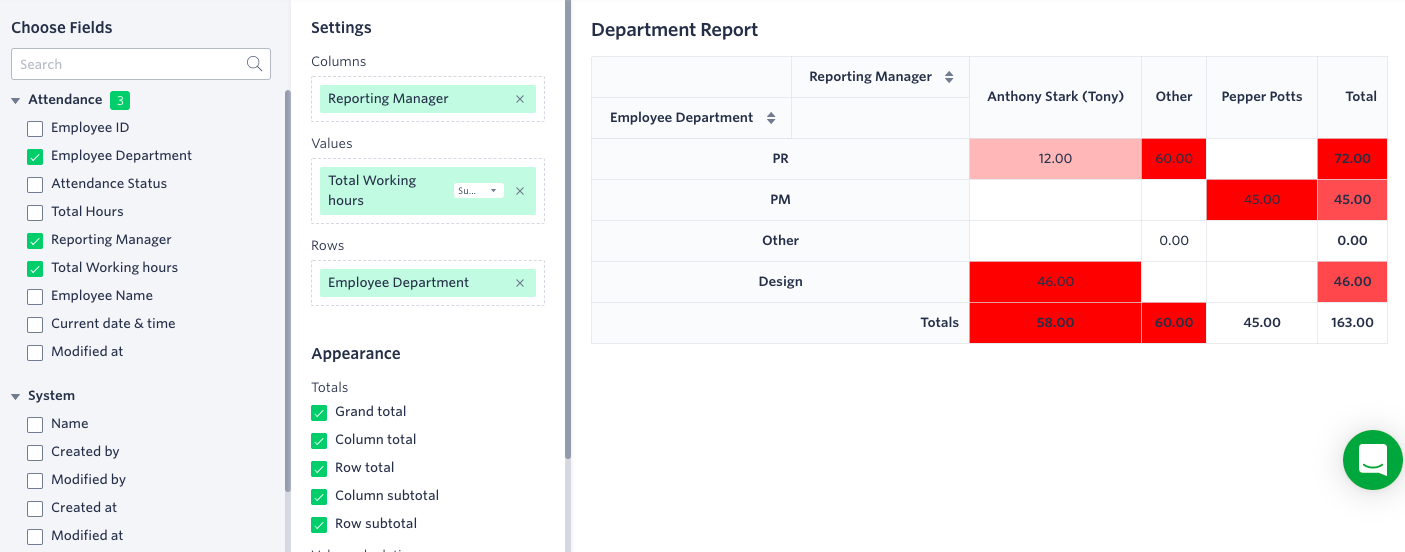
Settings: columns, values, rows
The fields you choose will automatically be added sequentially under Columns, Values, and Rows. Rows and columns are two dimensional data with which you can calculate the third dimension of values.

You can drag and drop the fields to reorient them, or click the X button to remove them.
Appearance
Under Totals, choose how you would like to perform the calculation.
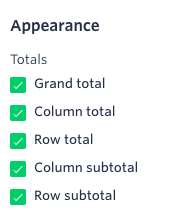
- Column total - select this to sum all the columns in the pivot table
- Grand total - select this to sum all the rows and columns in the pivot table
- Row total - select this to sum all the rows in the pivot table
- Column subtotal- select this to sum only a part of the column in the pivot table
- Row Subtotal - select this to sum only a part of the row in the pivot table
Value calculations
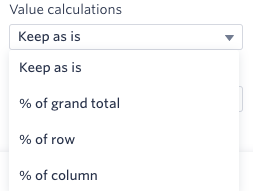
- Keep as is - don't change the values
- % of grand total - the table values will be displayed in percentage instead of sum.
- % of row - the row total will be displayed in percentage instead of sum.
- % of columns - the column total will be displayed in percentage instead of sum.
Heatmaps
A heat map shows the relationship between two items and provides rating information, such as high to low or poor to excellent. The rating information is displayed using shades of red depending on the saturation.
- By table - the values of the entire table are hued in the shades of red
- By row - the row values are hued in the shades of red
- By column - the column values are hued in the shades of red
- None - the values will not be hued

Filters
You can add filters based on a condition in your report. To add a filter to your report, click the Create Filter button. Choose the field that you want to based on your filter and then enter the conditions.
Click Test Filter to see how your filter would affect the sample report data.
Click +Add Condition to add more conditions to the same field. The new condition can be either AND (all conditions must be met) or OR (any one condition must be met).
Click Add Another Filter to add conditions based on another field. Report data must match all the filters you create. To remove a filter, click the Delete button (
Pivot table actions
Once you have configured your report you can view, edit and share the report.
Edit ( ) Click the edit button to make changes to the report. Click Done to save the changes.
If you share a report with someone, they can view the report but not edit it.